Synthia
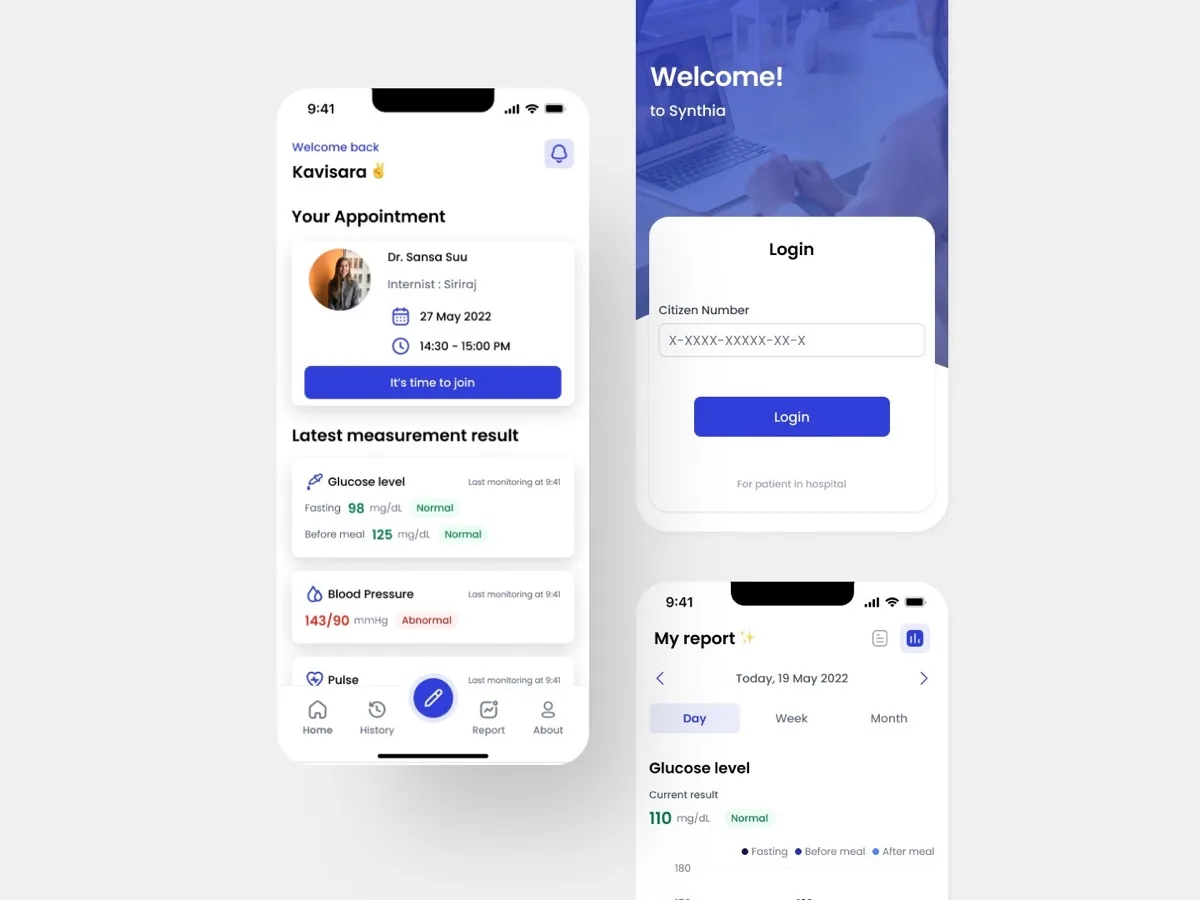
Synthia is a smart healthcare application to help both doctors and patients dealing with long-term health issues (NCDs) like diabetes and cardiovascular diseases.
- Role
- Product design
- Project type
- Senior capstone project
- Design tools
- Figma, FigJam, Tokens Studio
- Duration
- Aug 2023 - Nov 2023
- Teammates
- Me
- Sethanant Pipatpakorn
- Thanakorn Aungkunchuchod
OVERVIEW
Key points about Synthia
- Remote healthcare access.
- Patient save time and stay safe.
- Do it At-Home health monitoring
- Enhanced Doctor and Patient interaction
PROBLEM & GOAL
Problem
We’ve heard about Telemedicine during the COVID-19 pandemic, which can help patients who can’t travel to the hospital when it is under high workload. After, the hospital returned to its normal situation, there is still a high number of patients in the hospital. As a team, we felt it was necessary to help reduce the hospital’s workload and provide assistance to the doctors and staffs.
After conducting extensive research, I have discovered that non-communicable diseases are among the most prevalent health conditions affecting the global population. The information was obtained from “ World Health Organization”
“Noncommunicable diseases (NCDs) kill 41 million people each year, equivalent to 74% of all deaths globally”.
Goal
- By providing mobile application will help NCDs patients follow up their treatment.
- To let NCDs patients record their everyday important metrics (Blood pressure, Blood sugar). Ready to present the results in a more reader-friendly format.
- To improve the doctor’s diagnosis by providing more data analysis instead of using paper work.
- To save time of patients and doctor at the hospital. Furthermore, it reduces hospital visits for patients.
SOLUTION
Meet the doctor in video chat
- All the appointment will show in application.
- Help the doctors to reduce workload in the hospital.
- Patient have flexibility to receive treatment anywhere they prefer.
Record the data of patients to gain insight
- Collect the data from NCDs patients record everyday.
- Categorize data and transform it into visualizations that are easily understandable for doctors and patients.
- Assist in enhancing doctor’s diagnosis by providing more comprehensive data analysis.
- Embrace paper less usage.
Complete within a single application
- All of appointment, video call , get prescription, payment and record measurement result at a glance.
- Proficiency application as though virtual hospital.
Our Approach
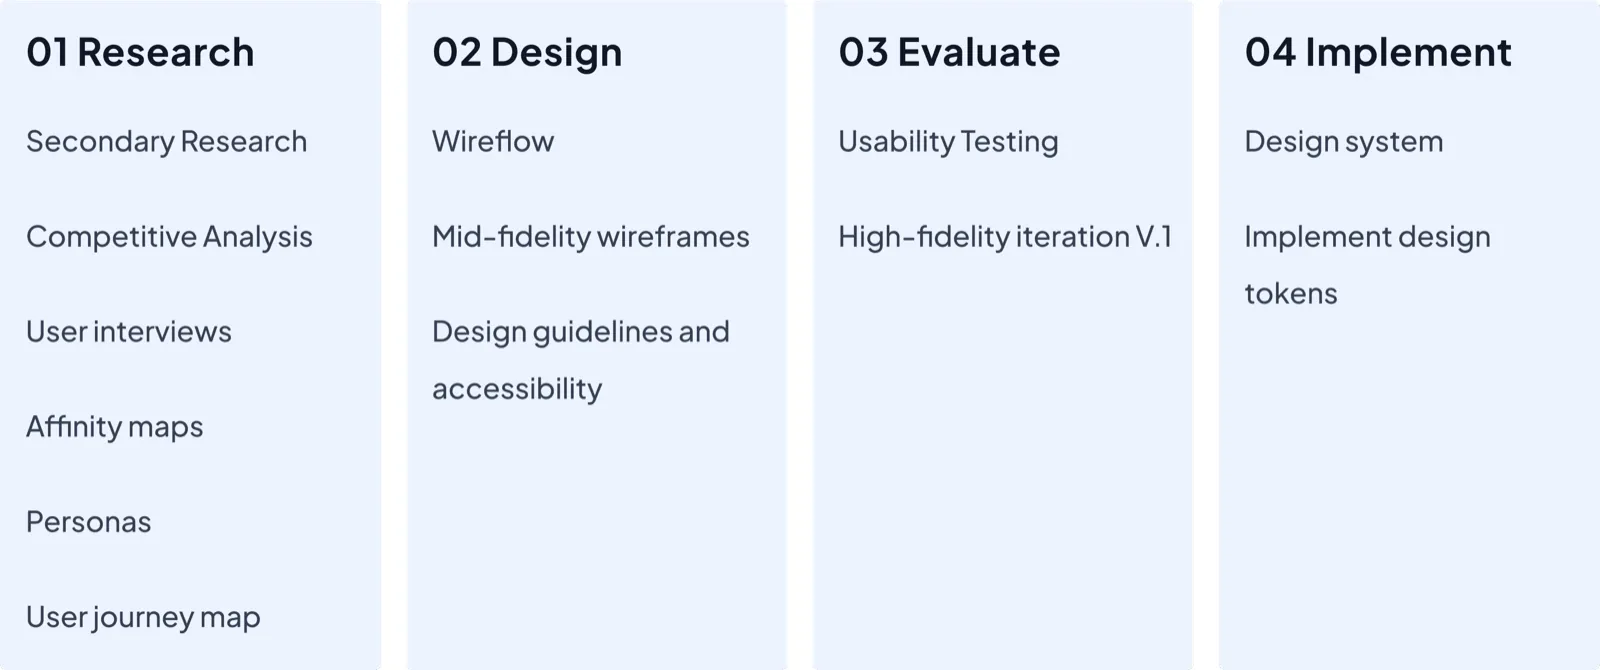
01 RESEARCH
Secondary Research
We conducted the secondary research for the keyword “Telemedicine and NCDs” to understand more about it. Finally, Our conclusion is shown below.
- The prediction shows that it will increase to approximately 9.9% or 425 million adults in 2045.
- Telemedicine has been suggested as an approach to support people with diabetes.
- Examples of telemedicine use cases are video consultation, and patient data collection (e.g., blood glucose, blood pressure).
- The patient can receive feedback from health care professionals via web portal interfaces or the telephone.
- Telemedicine could be a solution for diabetes patient which provide self-management support.
Competitive analysis
For the competitive analysis, we focused on appointment systems of different hospitals and daily life-log application. We conclude that existing applications do not have the appointment video call functionality within the application. Moreover, I found that almost application hadn’t supported specific group of patient such as diabetes type 1. This gave me a chance to find the solution.
 Rama App
 DMThai Diary
 Siriraj Connect
The products we looked at for the competitive analysis
User Interviews
I formulated the questions to gain the deeper understanding of the critical challenges experienced between patients and doctors.
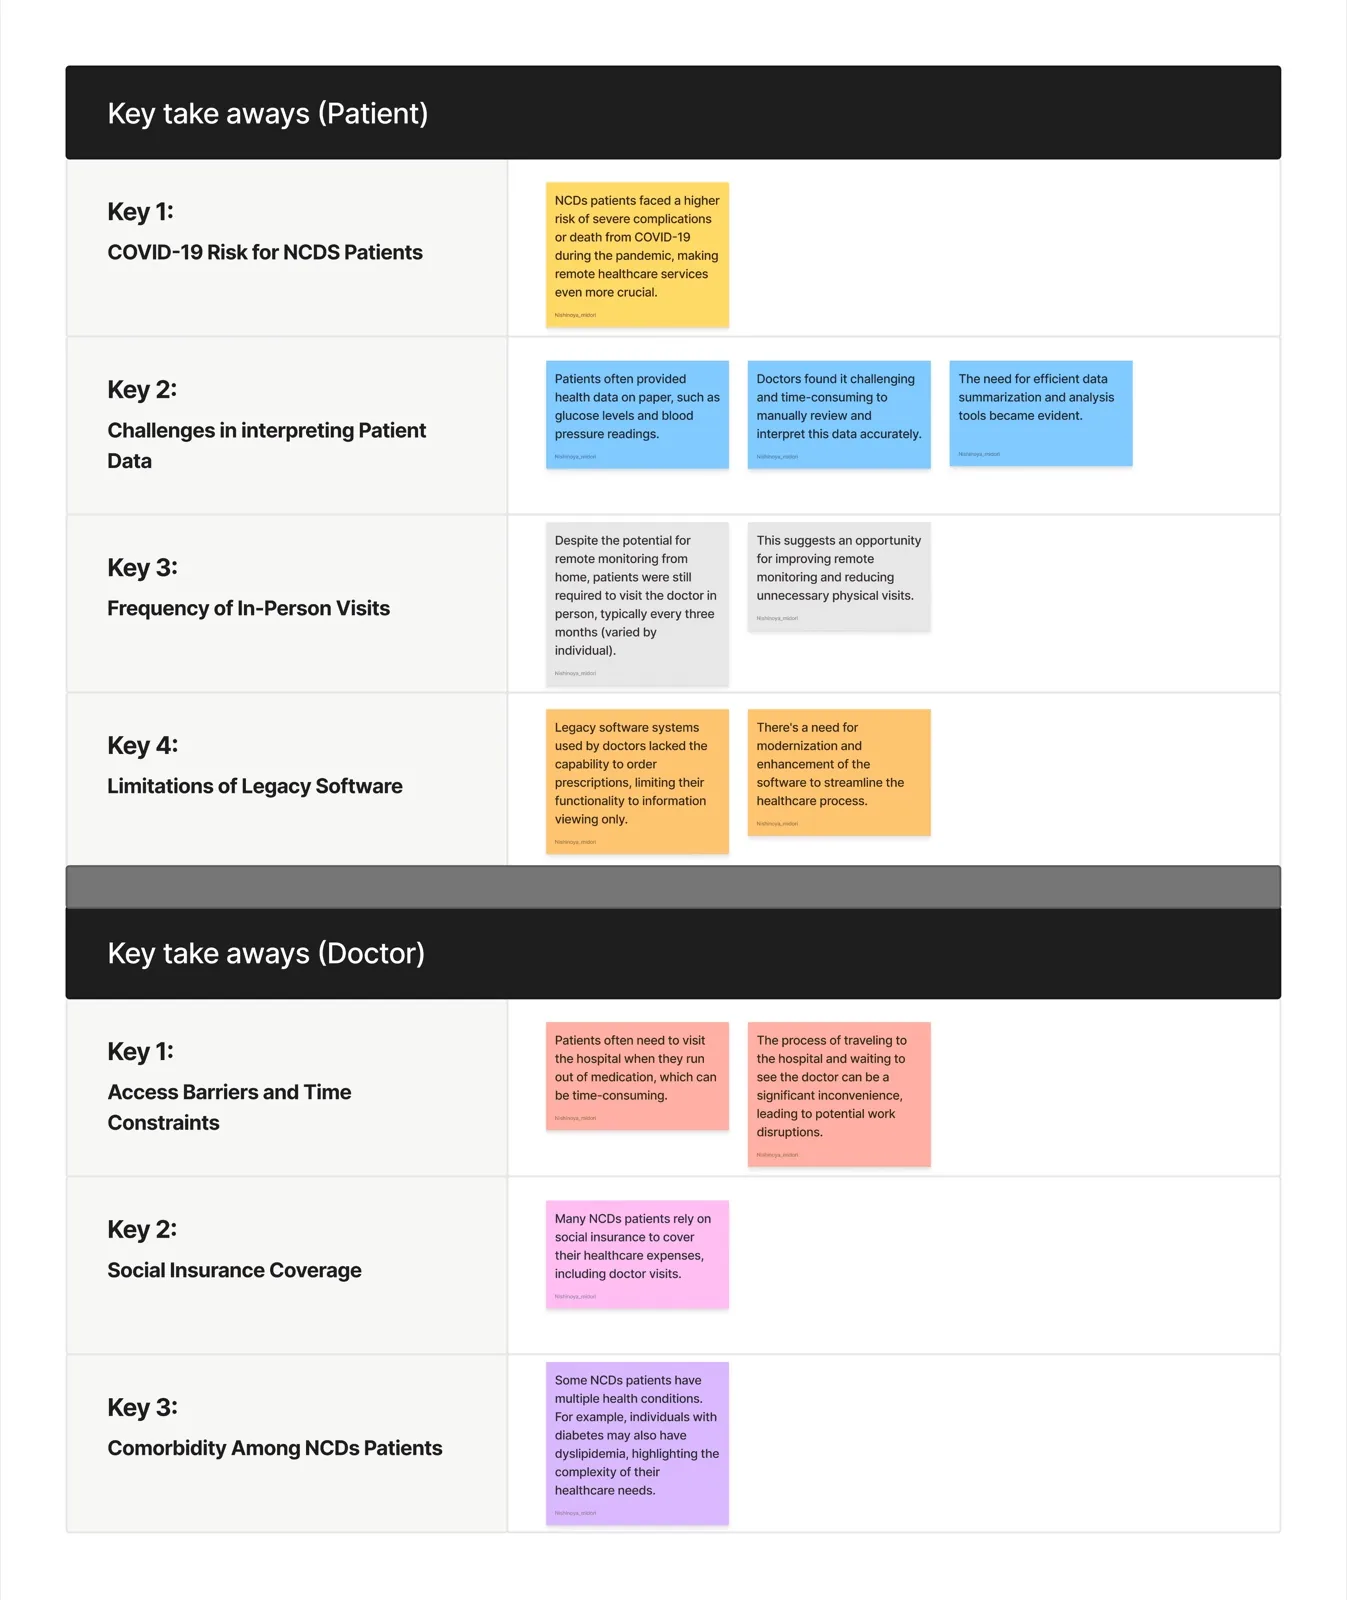
The key idea was the way how the challenges NCDs patients face in traveling to physical hospitals and how doctors conduct medical assessments to diagnose NCDs patients.I’ve conducted interviews with 5 patients and 3 doctors and staffs. After collecting interviewee data, I used affinity mapping to brainstorm based on our findings.
I usually record my glucose level and blood pressure everyday using Excel or paper ,and then I print the data for the doctor.
During the pandemic, I haven’t followed up with the doctor for 3 months. I received the medicine either by driving to hospital or using delivery services.
I want to see various patient parameters, such as blood sugar levels and blood pressure, for the past three months when I haven't seen the patient. This will allow me to make a more accurate diagnosis, not just relying on checking blood sugar levels shortly before seeing the doctor.
Main insights (Affinity maps)
User personas
After conducting the research, I created three personas, consisting of two patient personas and one doctor persona.
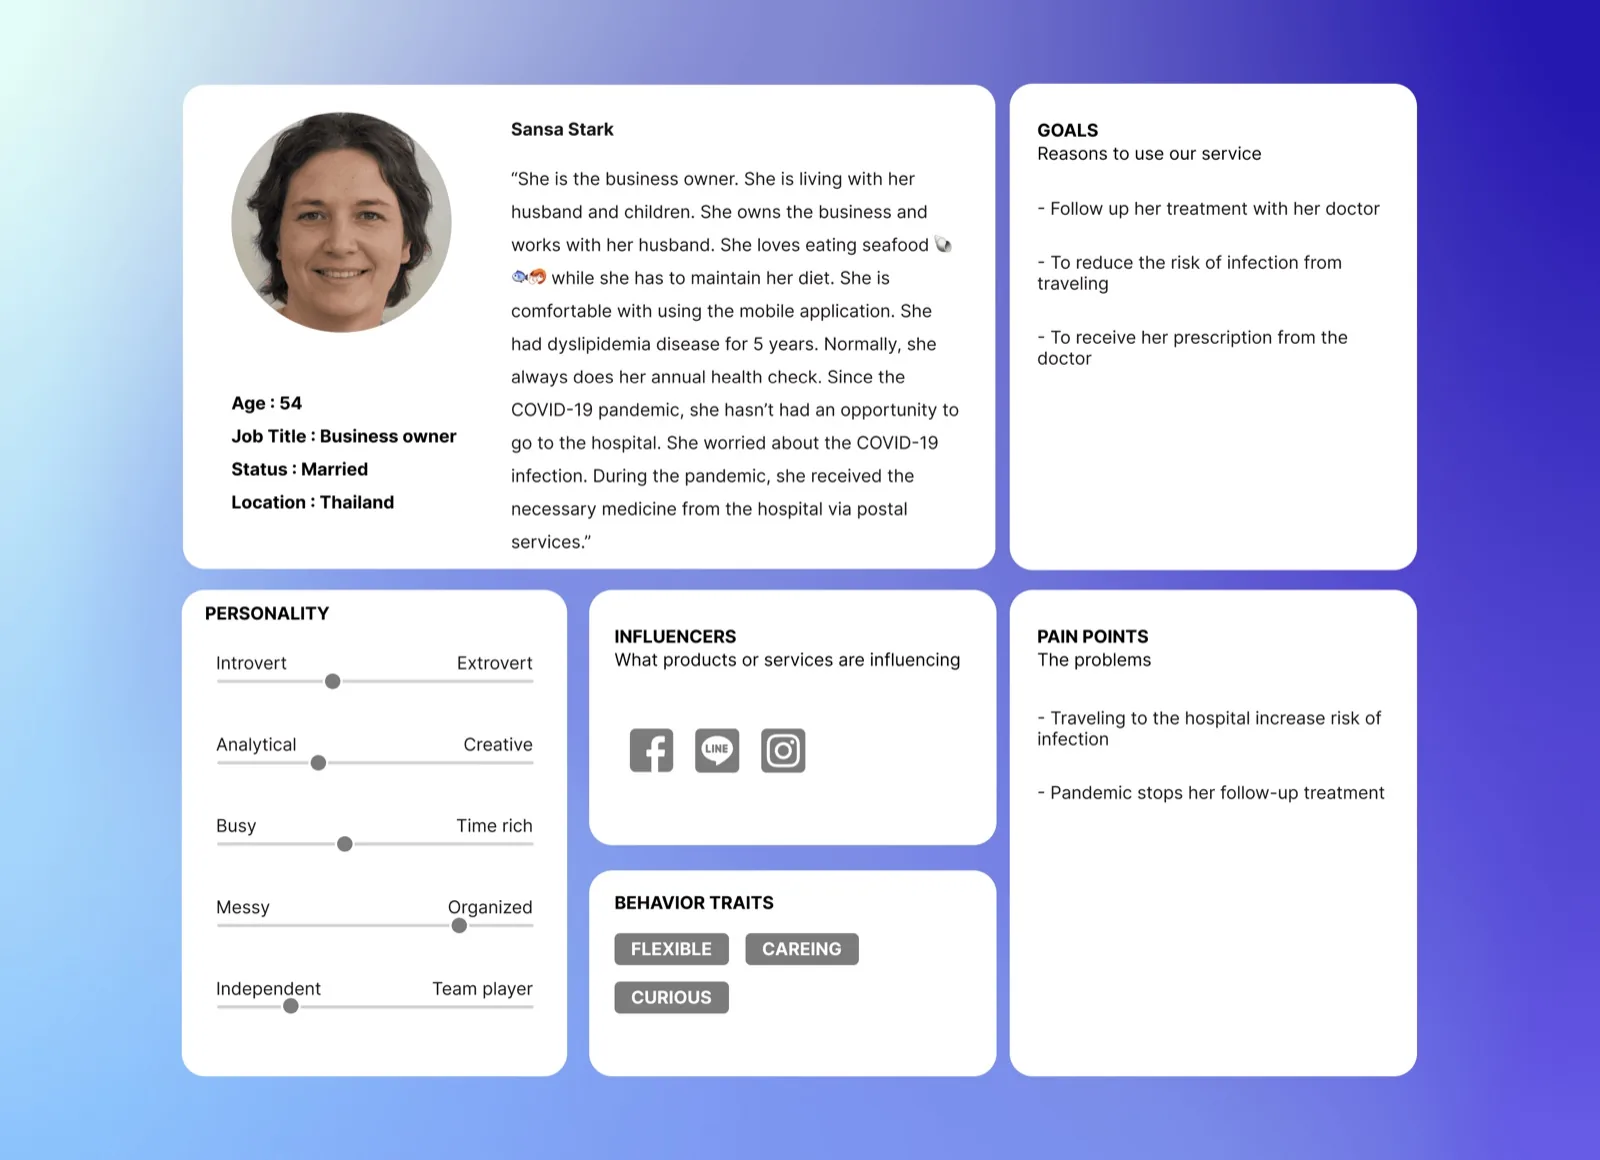
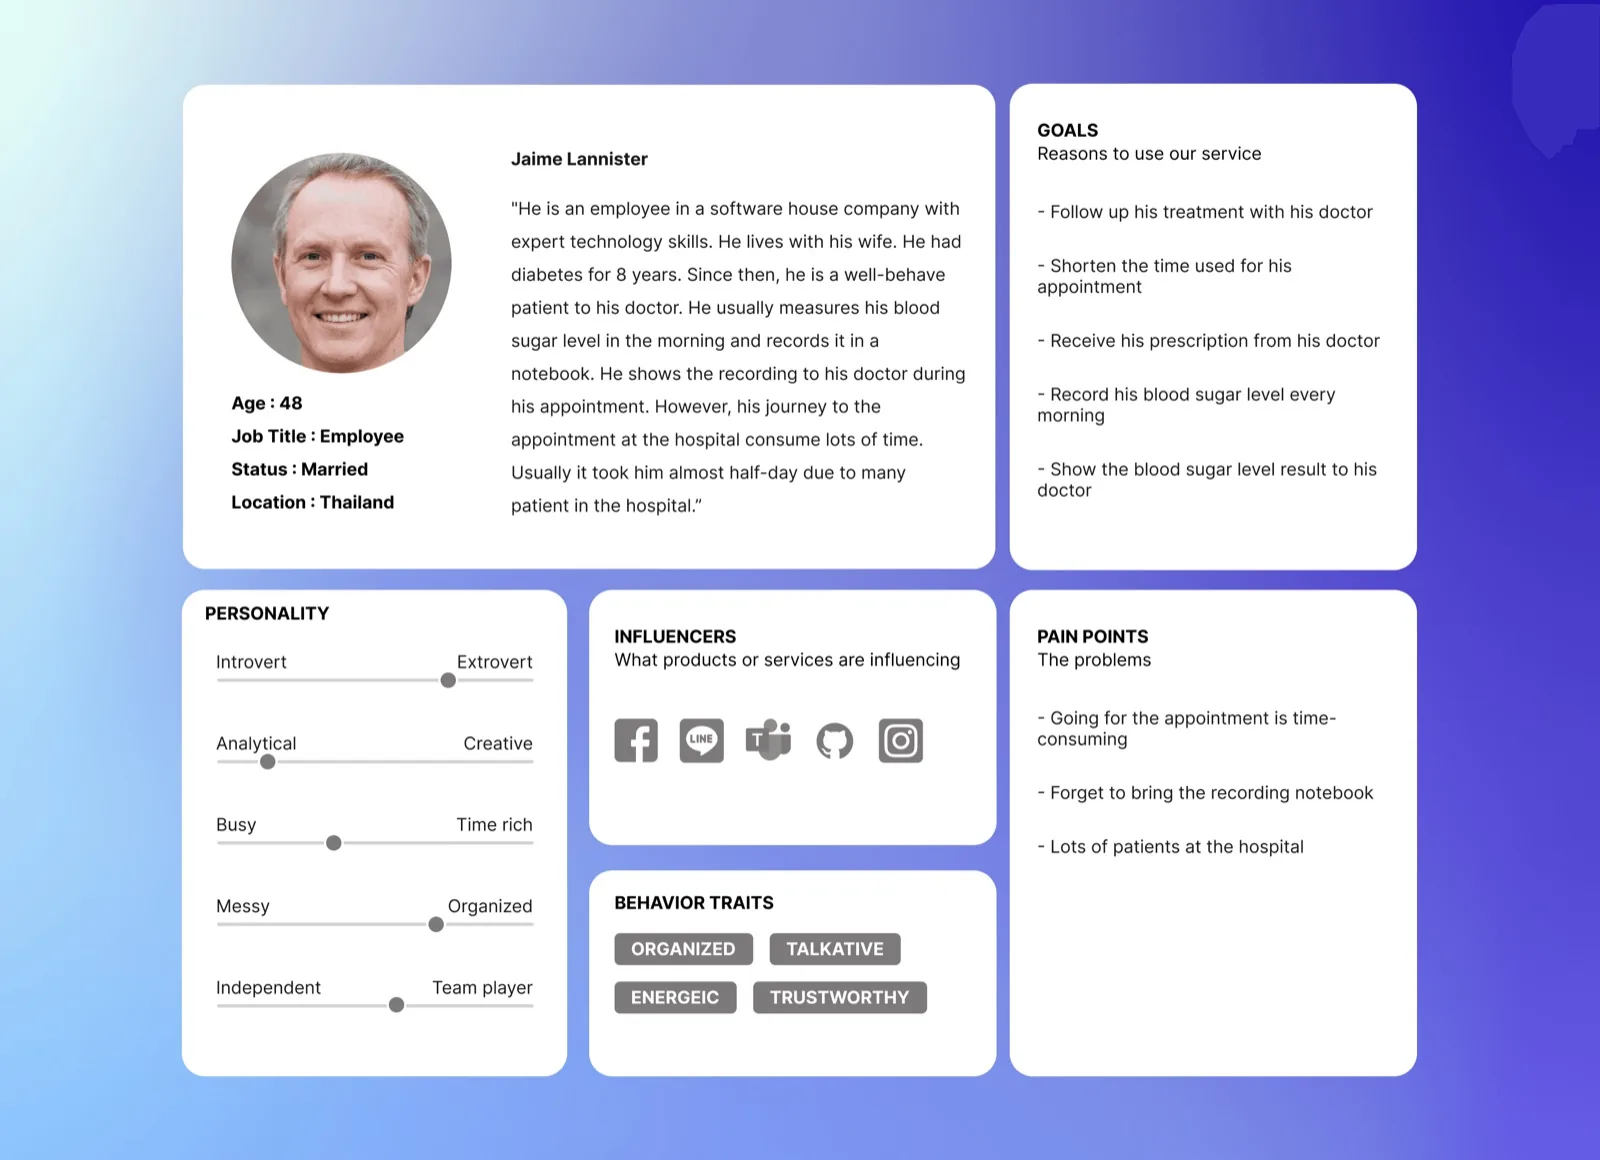
Patient persona
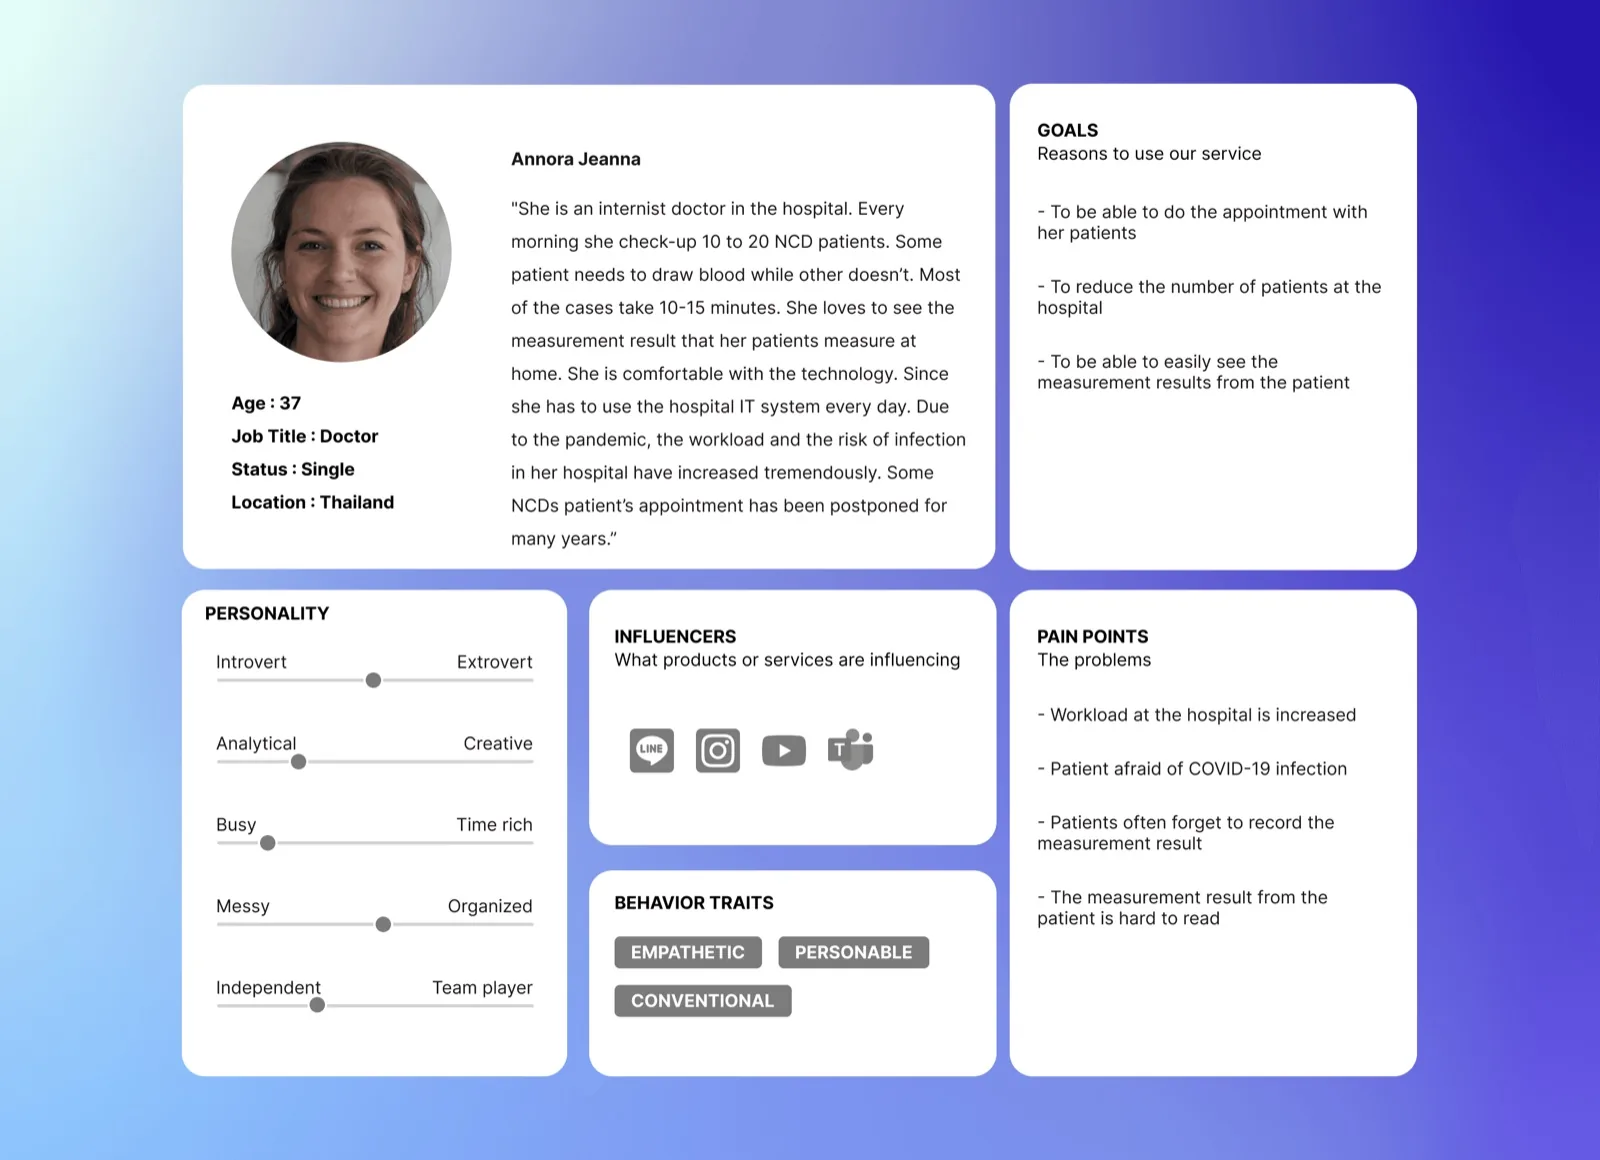
Doctor persona
User journey map
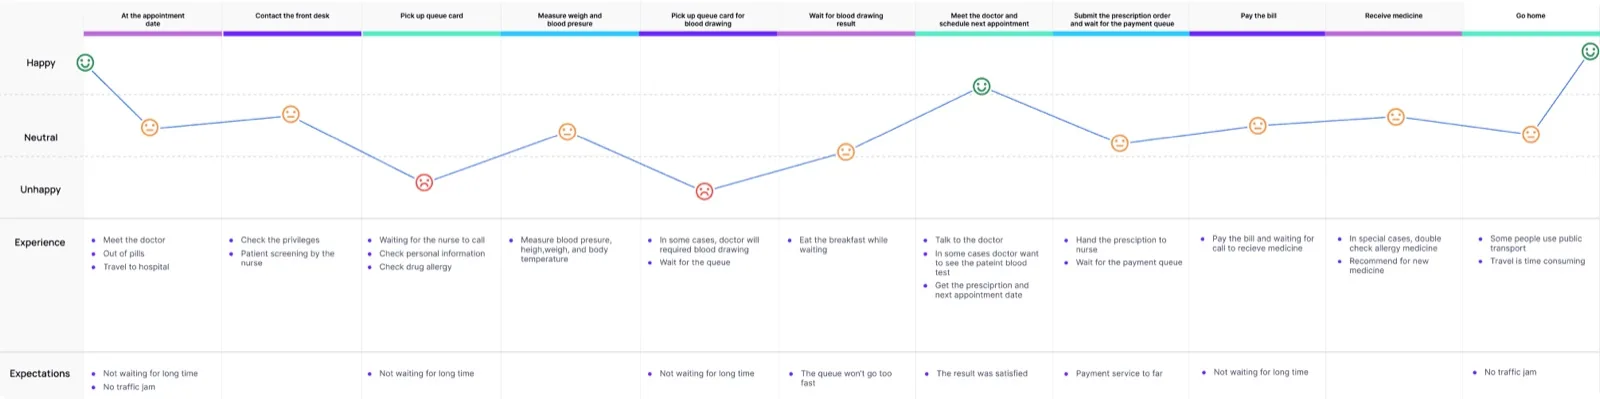
To understand the patient's journey, I conducted a brief survey at Thammasat University Hospital. Following the survey, I constructed a patient journey map to reflect the emotions of patients, as obtained from user interviews throughout the various processes. This map outlines the experiences and expectations during the process, as well as the feelings patients encounter when faced with different situations.
02 DESIGN
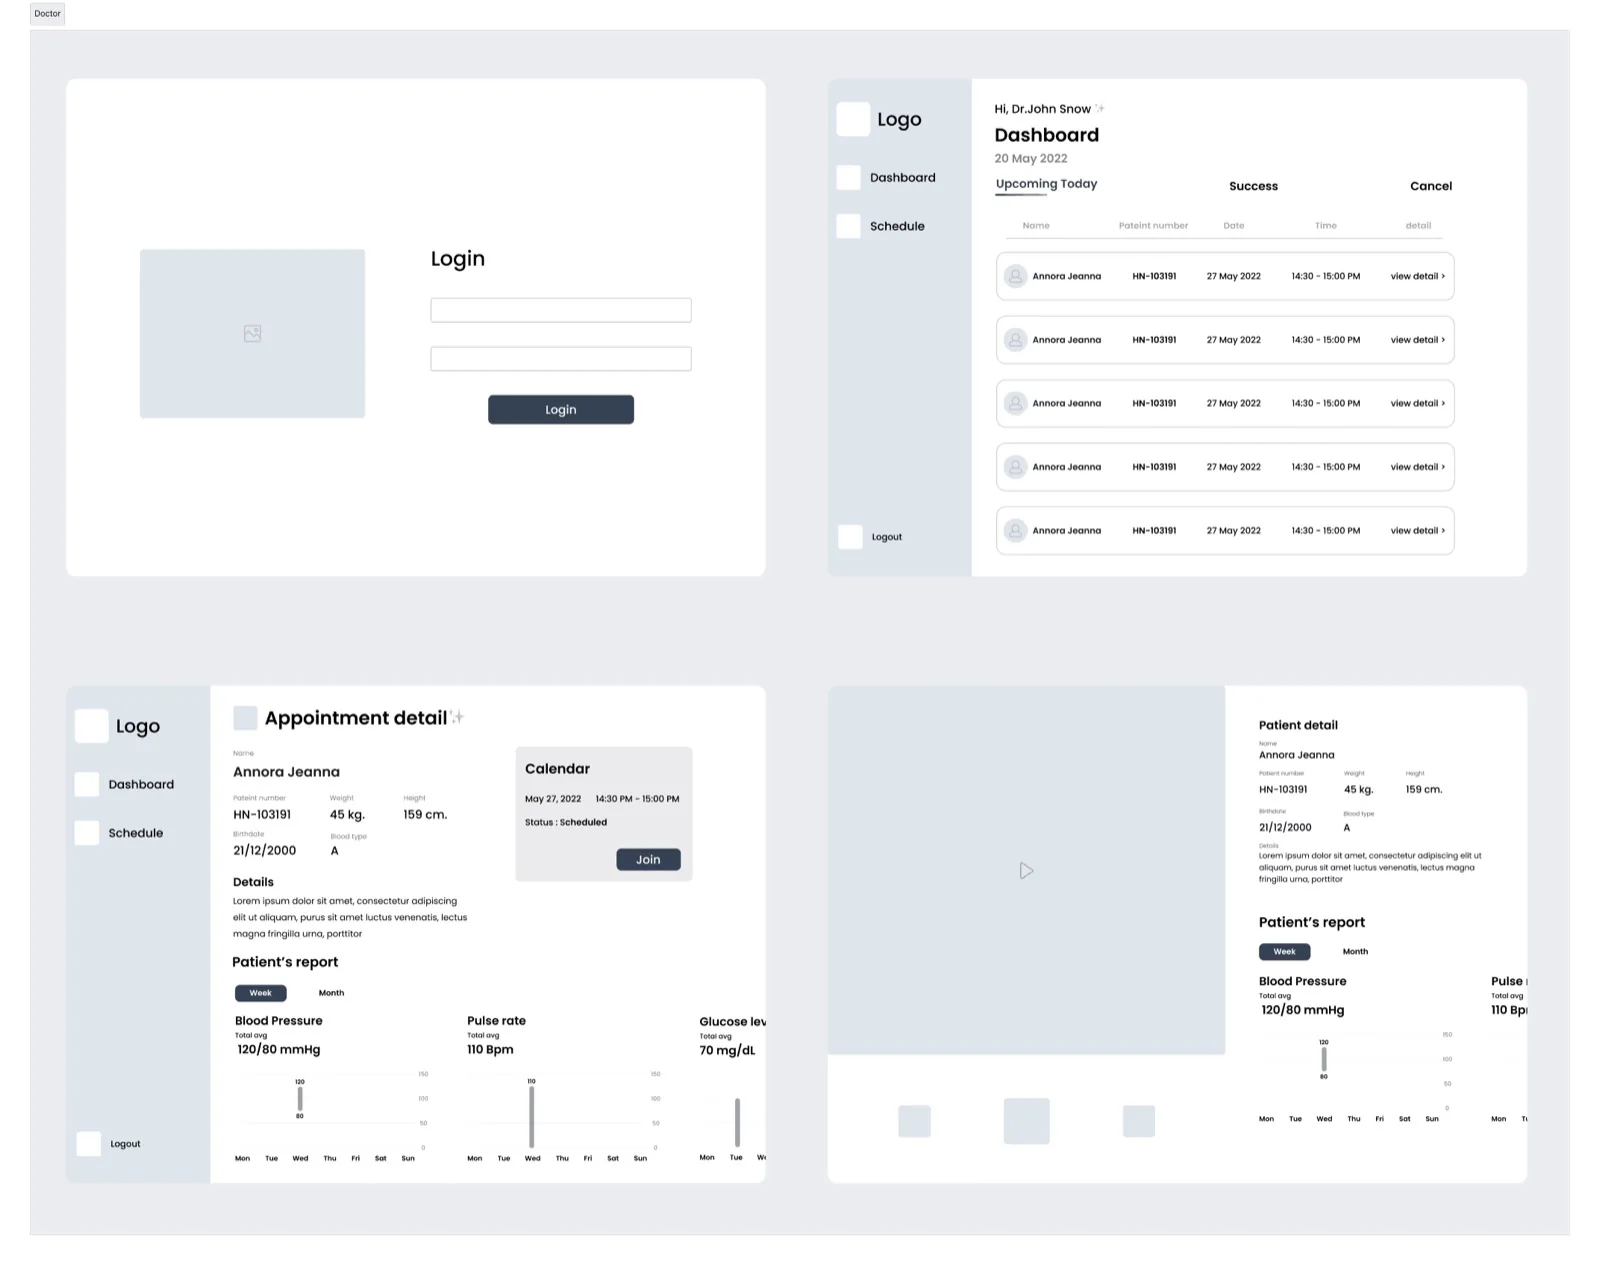
Wire flow
As a product designer, I have experience in discussing data privacy and deciding what data can be displayed on the application. Since, I also have a background in development, I wanted to better understand the topic with my teammates. Therefore, we decided to work together to create wire-flows.
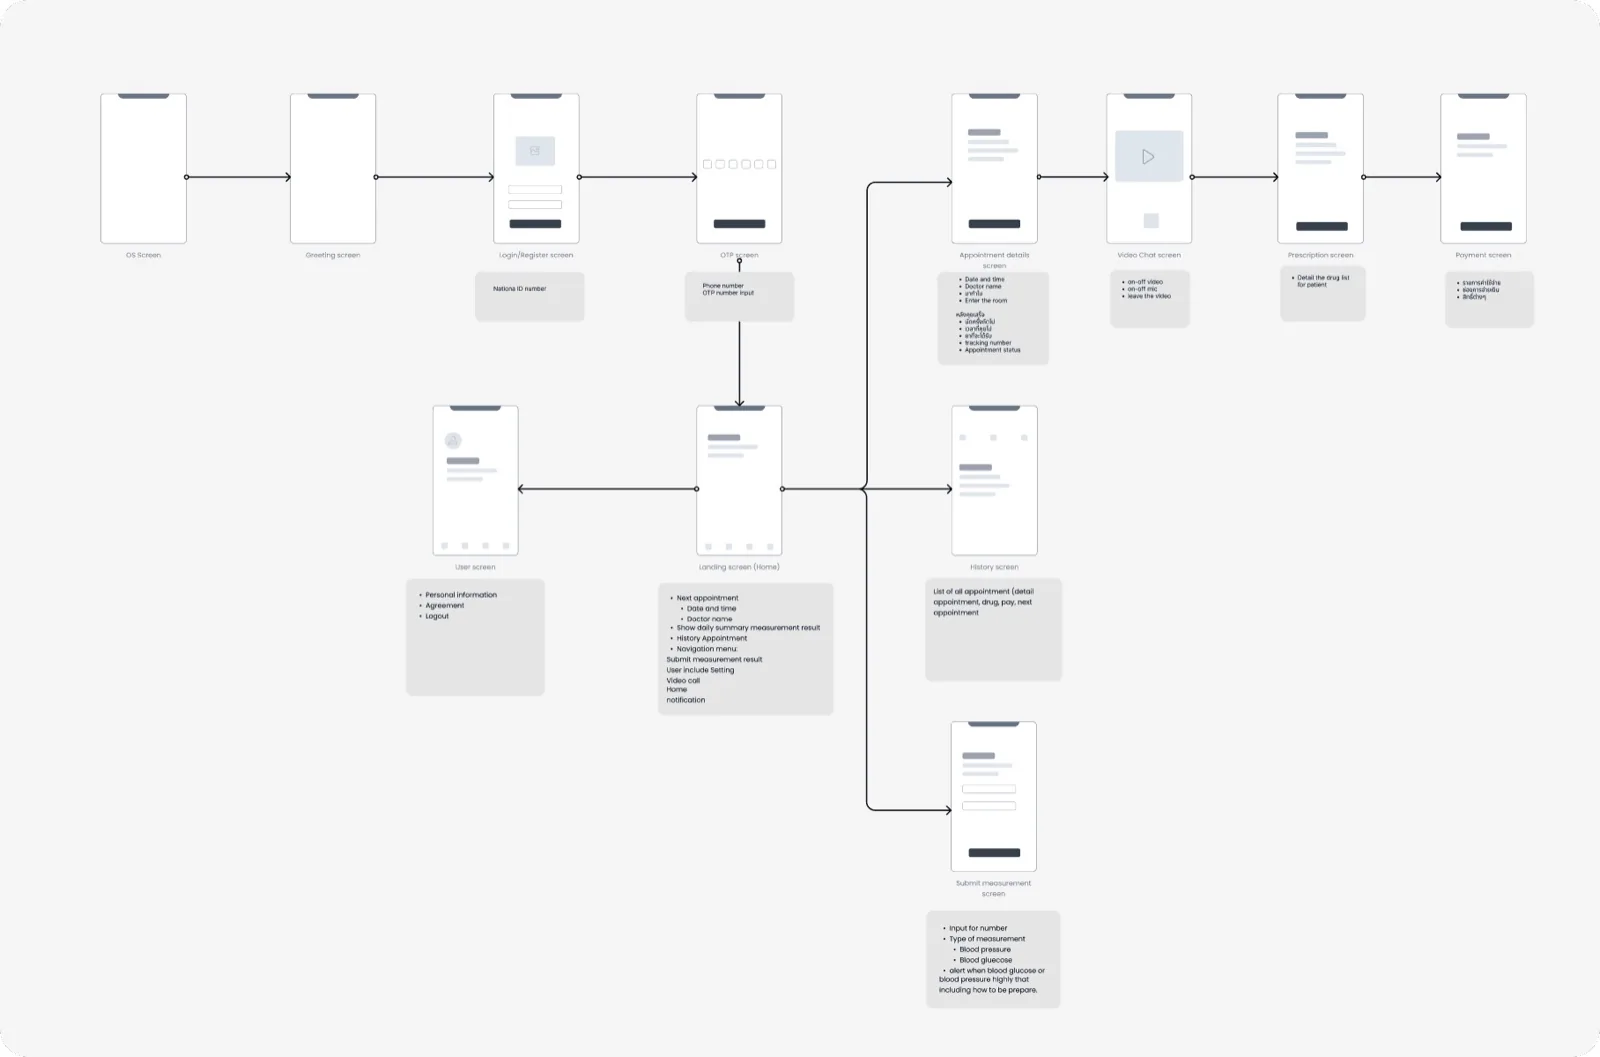
patient flow in a mobile application
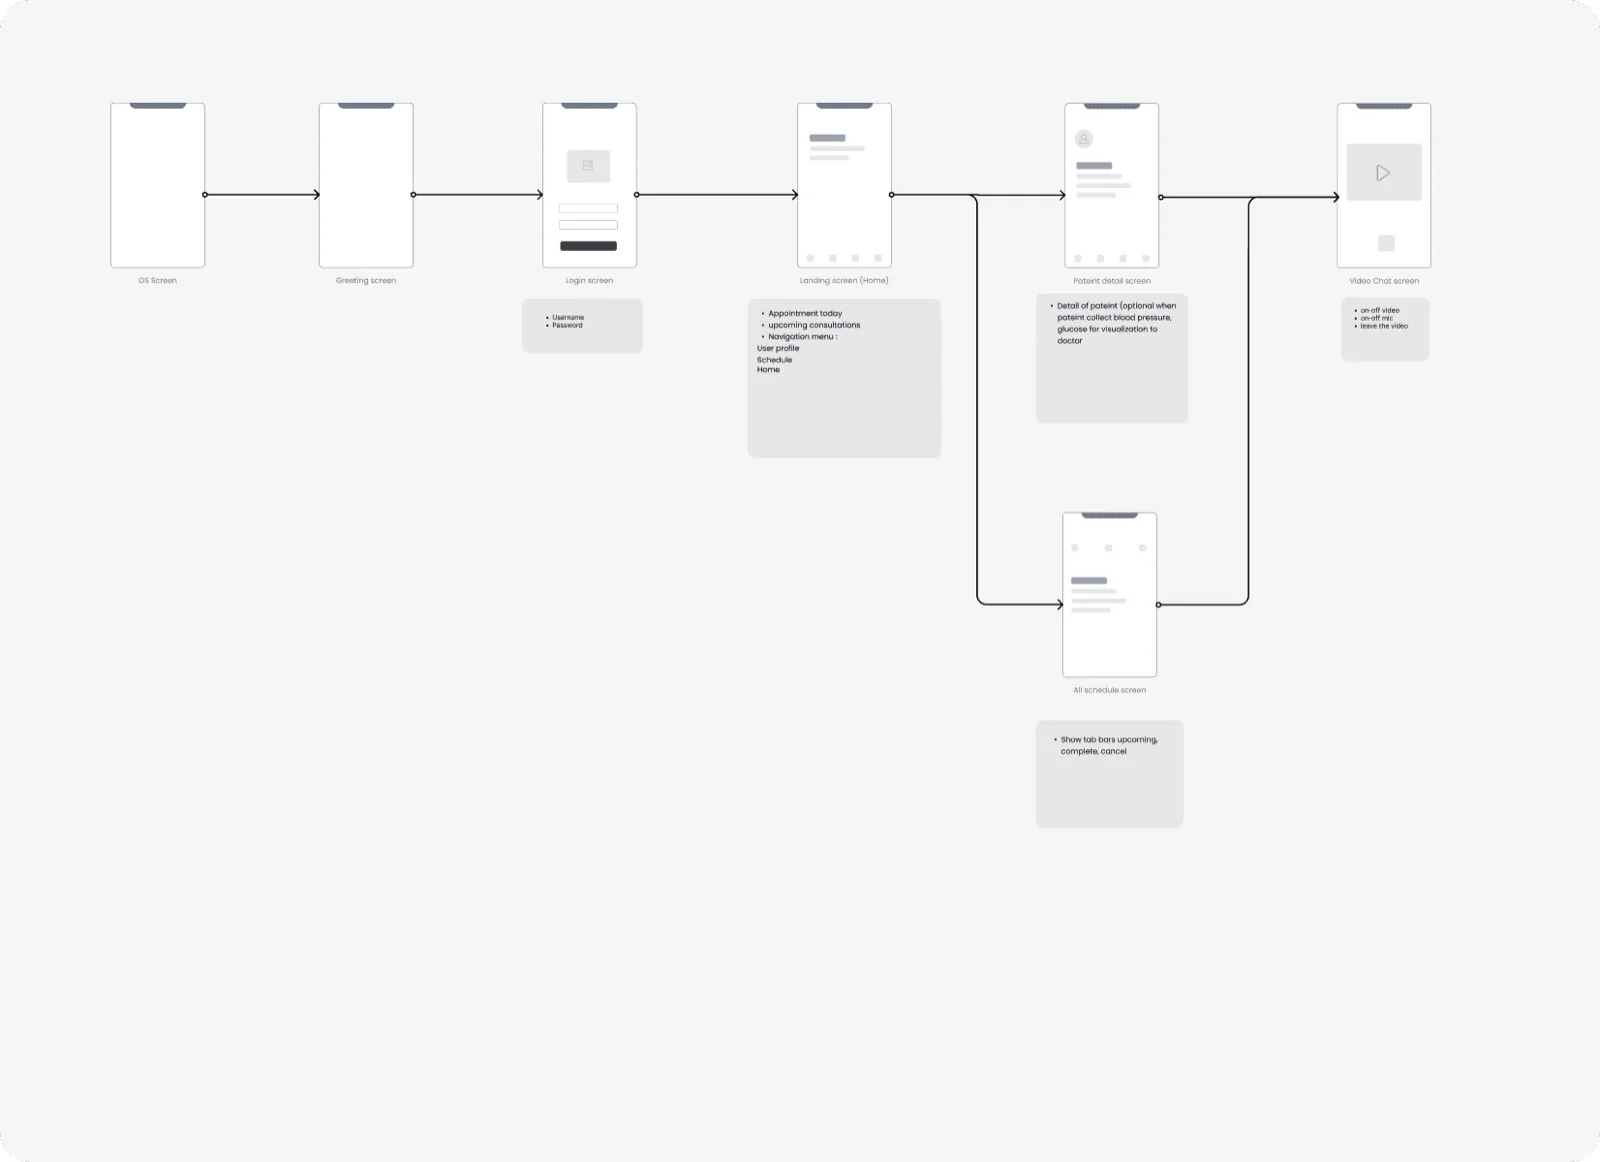
Doctor flow in a website
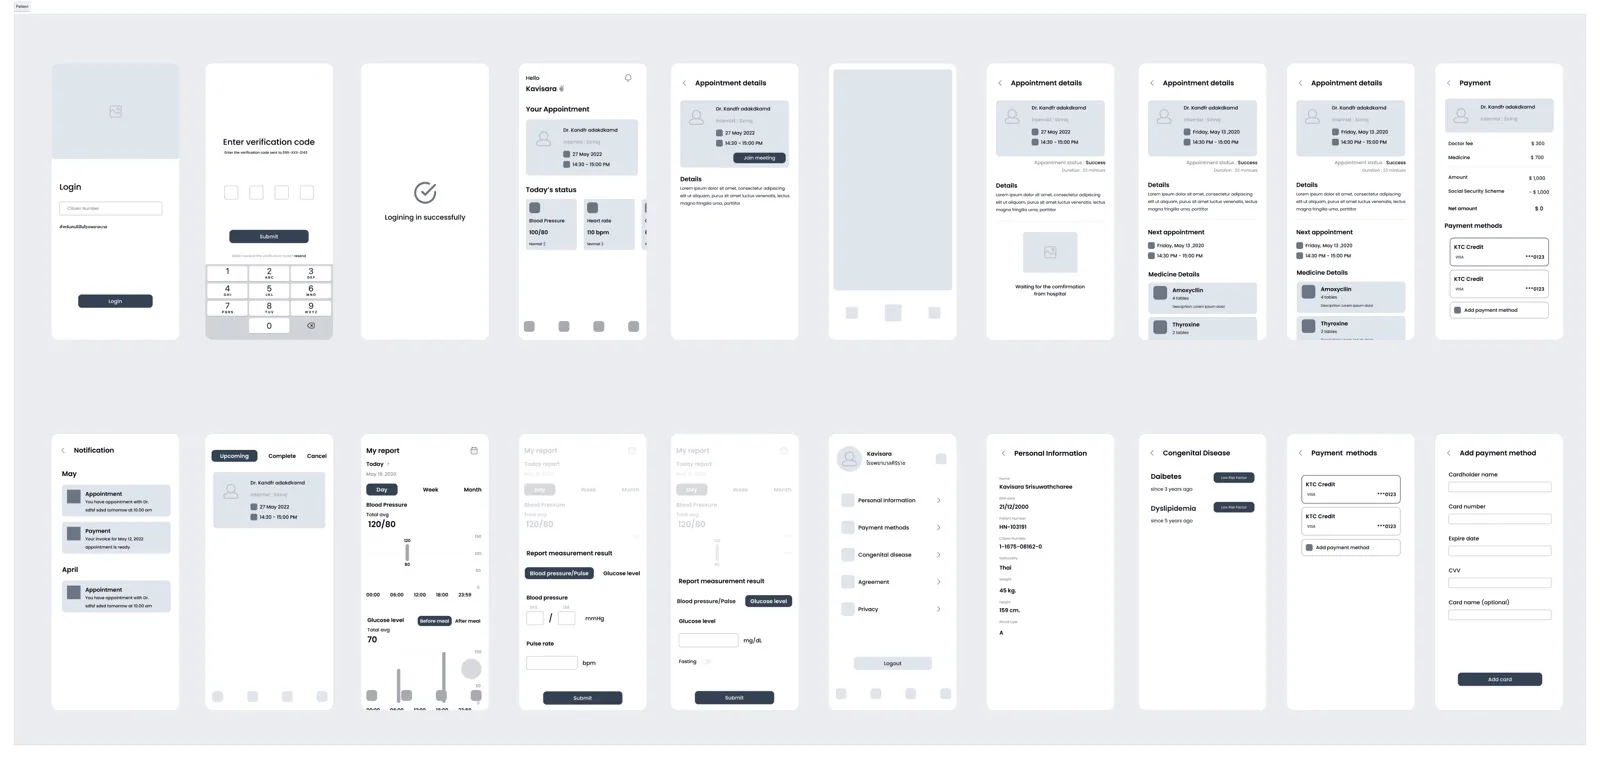
Mid-fidelity wireframes
Design guidelines and accessibility
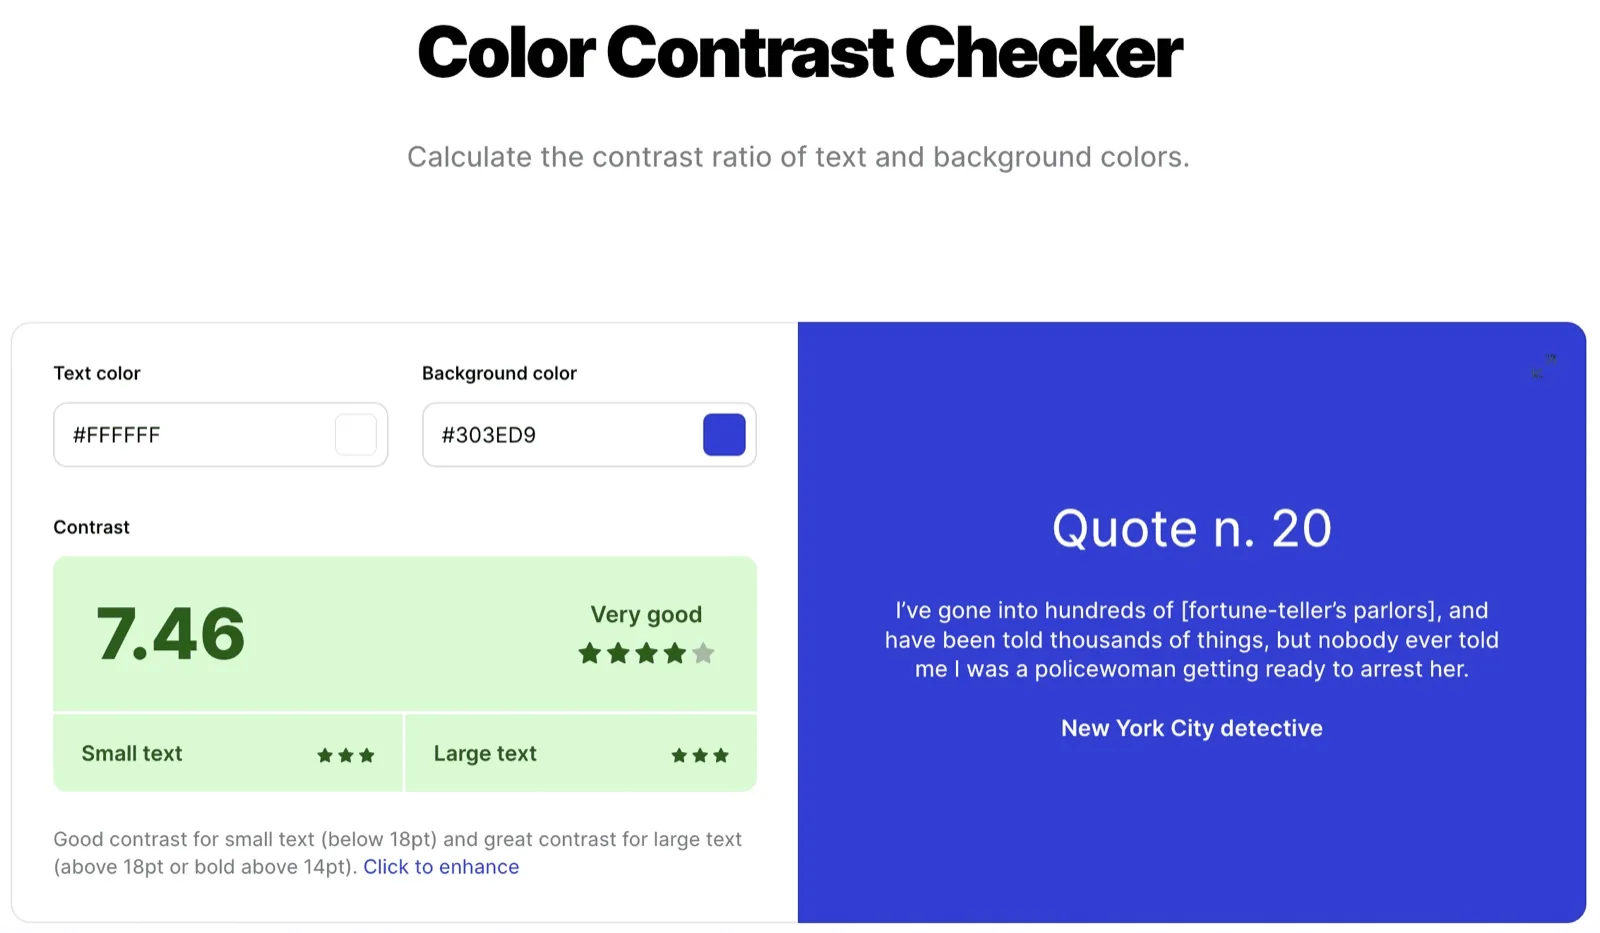
Patients with NCDs come from various age groups, especially including elderly individuals. Therefore, I need to ensure that everyone can use the application. I have followed the Web Content Accessibility Guidelines (WCAG) to achieve this.
Colours
- Primary color contrast at least 7:1.
- White space on pages.
- Make contrast accent color (Ex. red, orange, green).
- Foreground and background must be completely color contrast.
Site elements
- Make Call-To-Action to easier to click.
- Secondary button to illustrate the link.
- Use clear headings and labels to help older users find their way around the application
- Use a clean layout with clear visual hierarchy.
Font
- Body text size based 16px.
- Use Clear and Readable Typography
- Fonts that are easy to read.
- Use sans-serif style.
- Avoid extremely small font.
03 EVALUATE
High-fidelity iteration version 1
User feedback
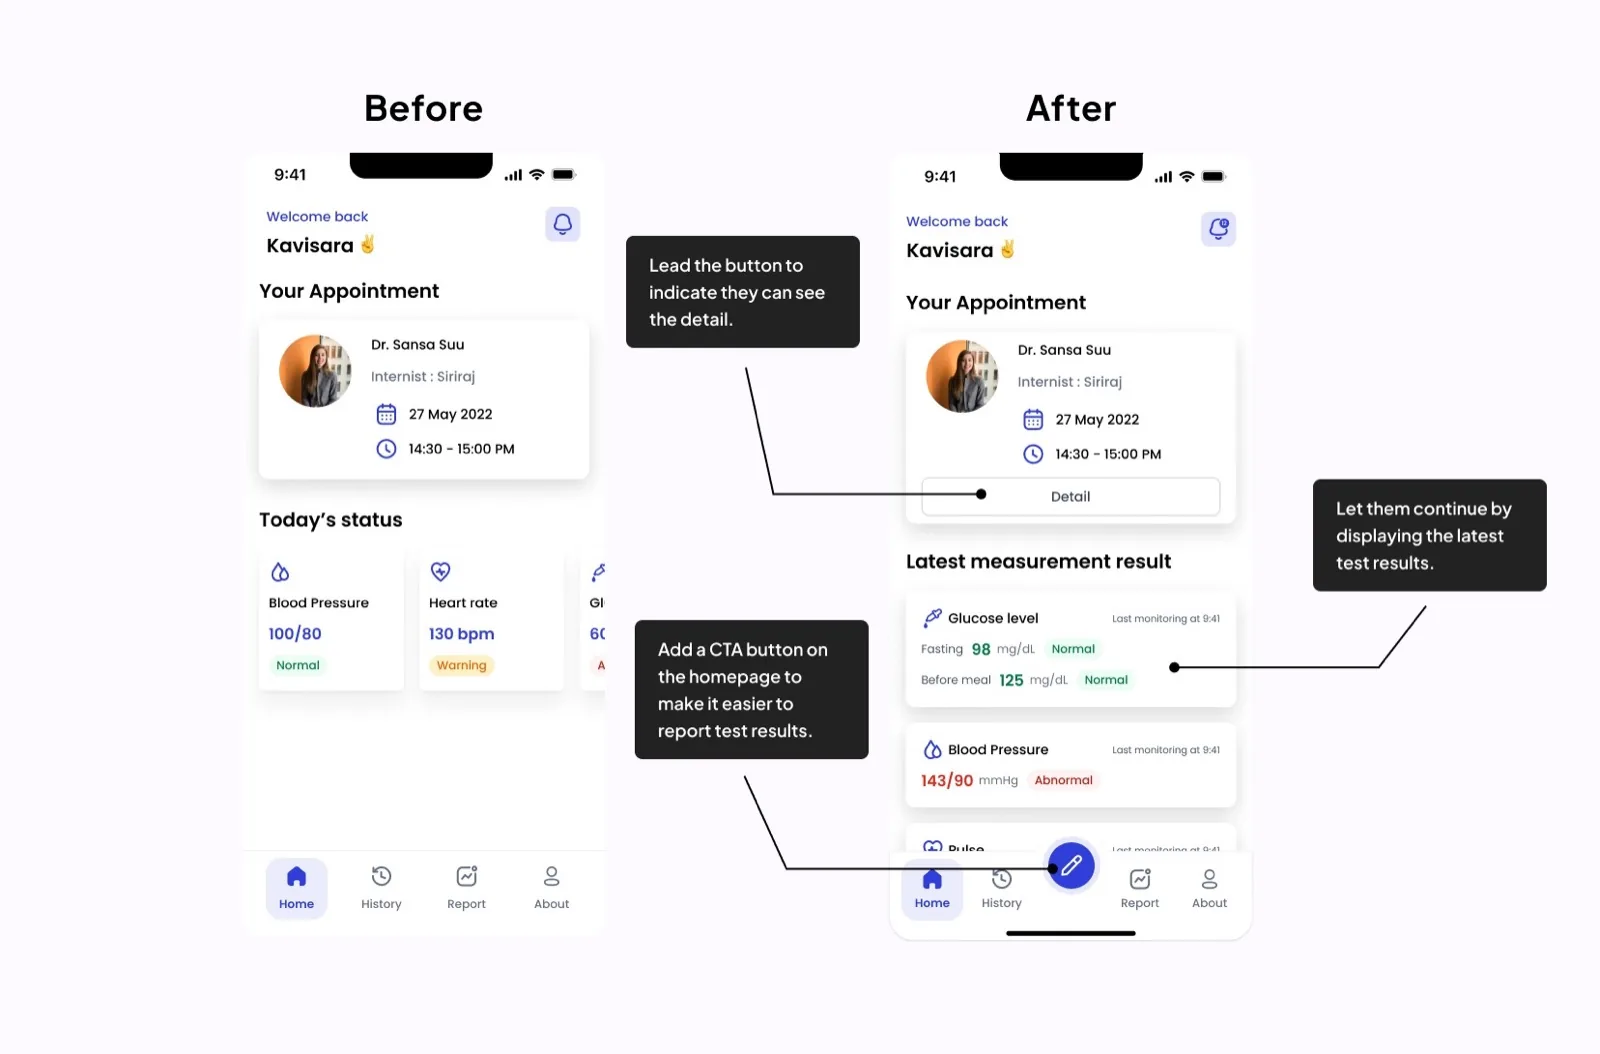
After completing the design of the first version, I conducted testing with the users I had previously interviewed. Almost all of the users wanted to view visualizations by day, such as viewing data for the past 7 days, and by month for easier comprehension. At the same time, the doctor also wanted to access patient data in various formats, and have the ability to receive immediate notifications for any abnormal patient data.
Refined design goal and feature
Home page
Home screen
Visualization report data
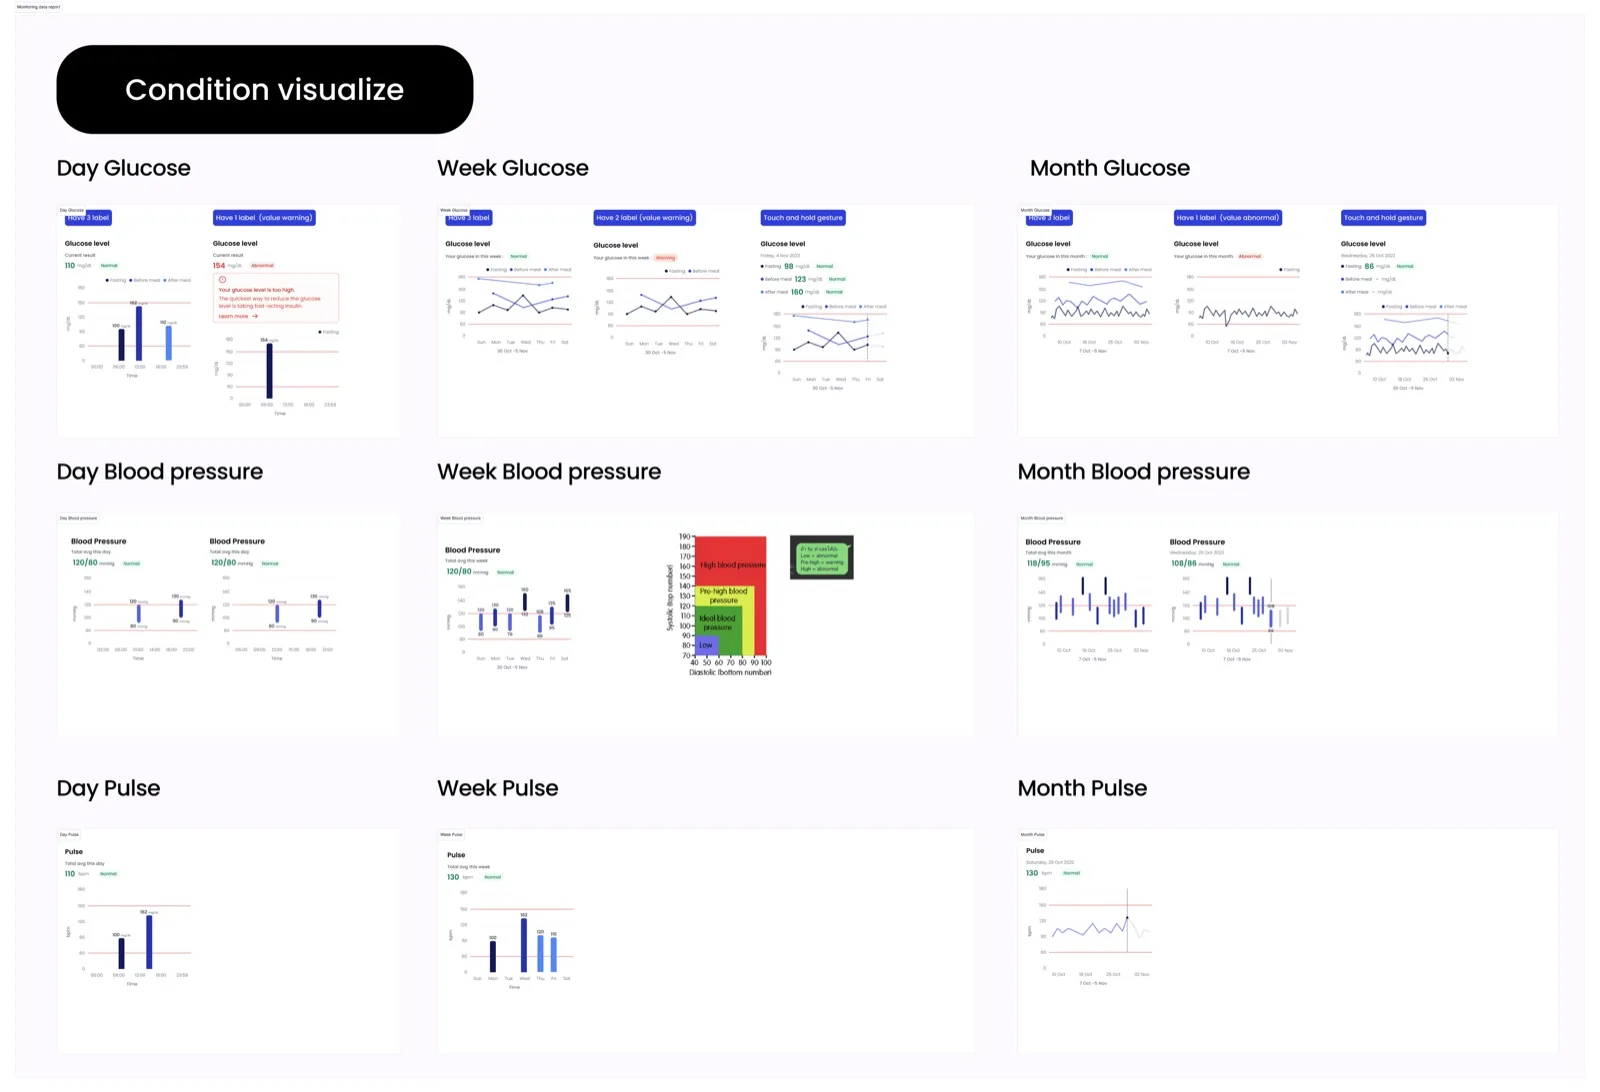
In this session, I conducted research on trustworthy websites (CDC and American Diabetes Association) to gather data for display in the application. I have also verified the data with the doctor to ensure accuracy. You can follow this article to learn more about the information I gathered, my approach to working with the data, and how I envision visualizing it for patients.
Data representing days, weeks, months is to be visualized on the mobile application for the user.
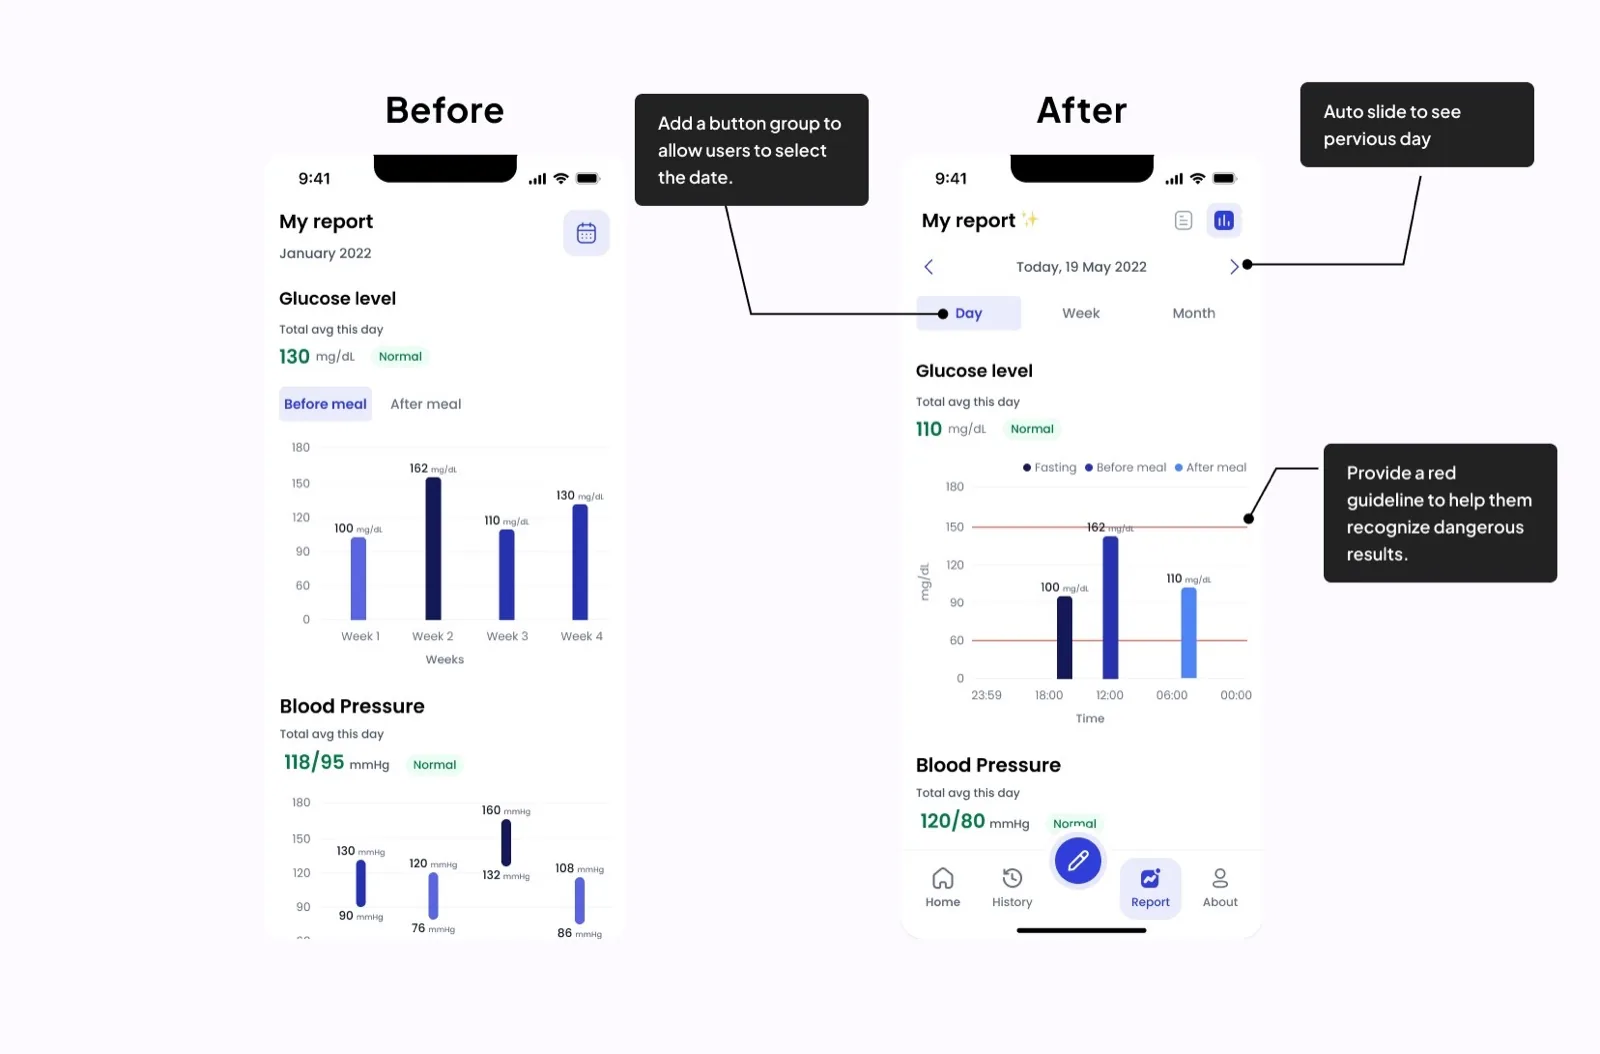
Data report screen
04 IMPLEMENT
Design system and implement design tokens
After creating Synthia’s design system and tokens to deliver to the developer. I utilize three tools: Tokens Studio For Figma, Style Dictionary, and the Tailwind library.
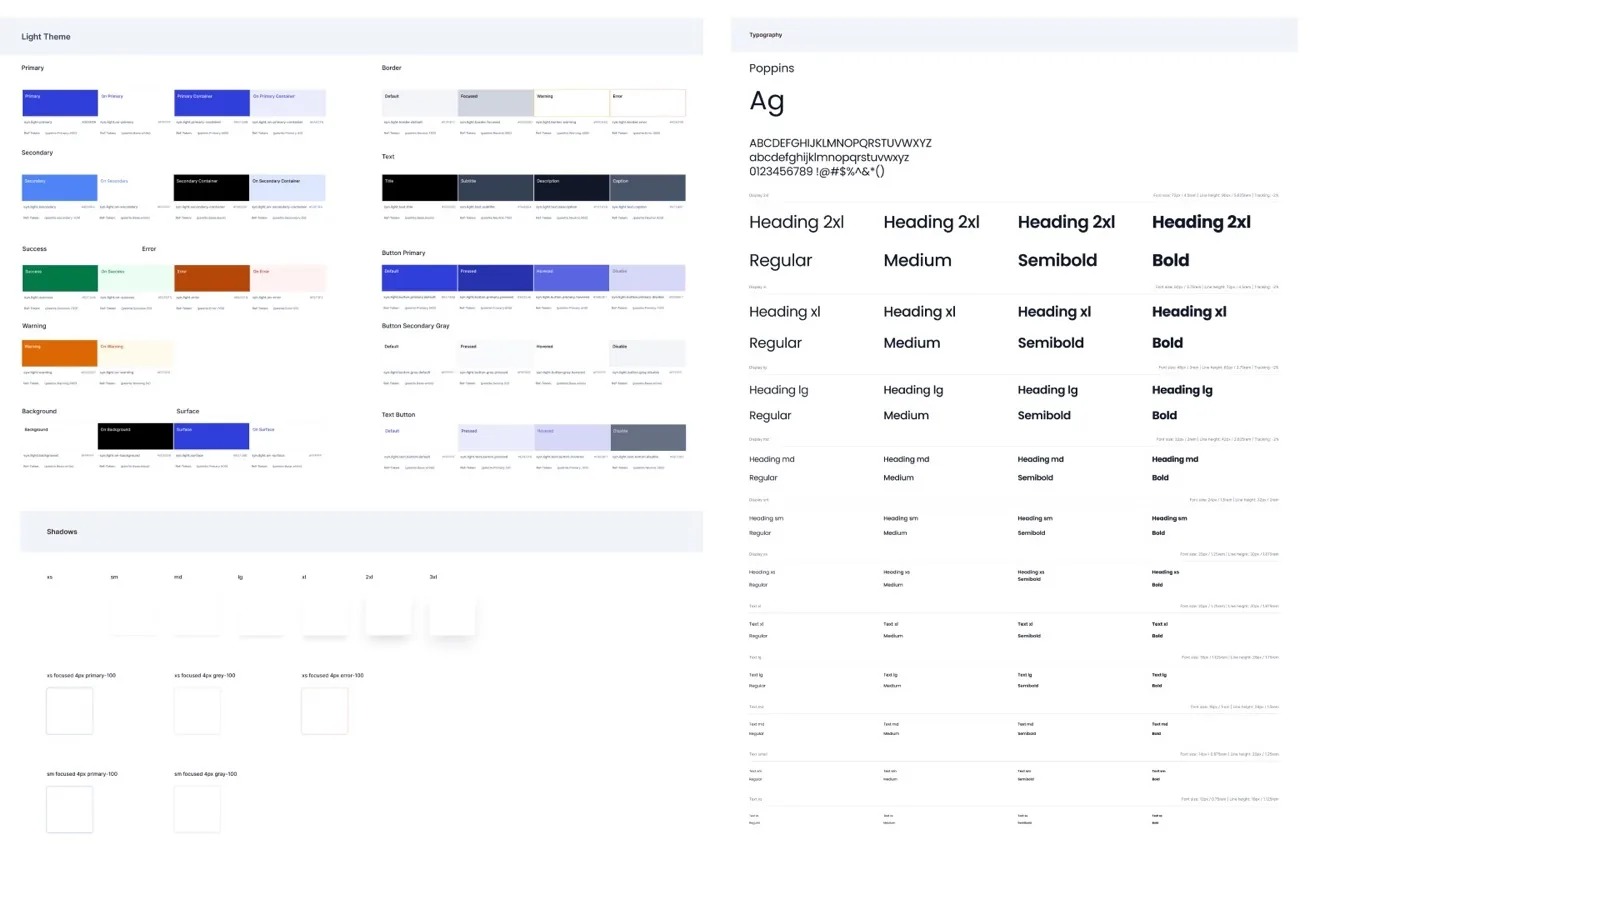
Mandatory elements which are color, typography,and shadow
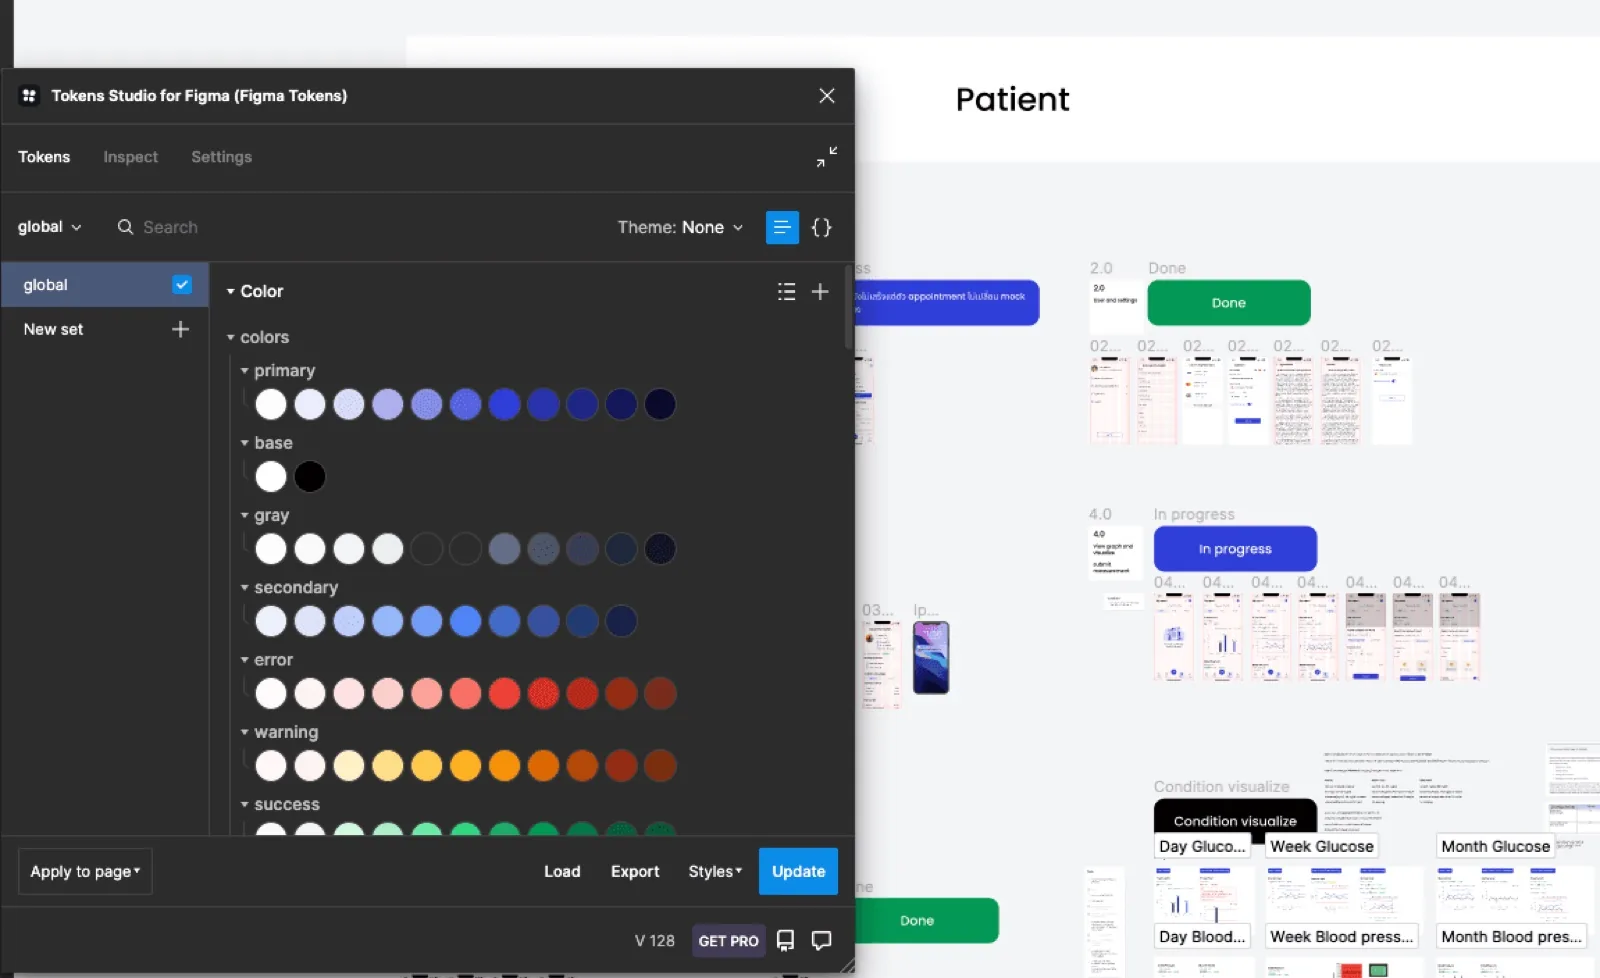
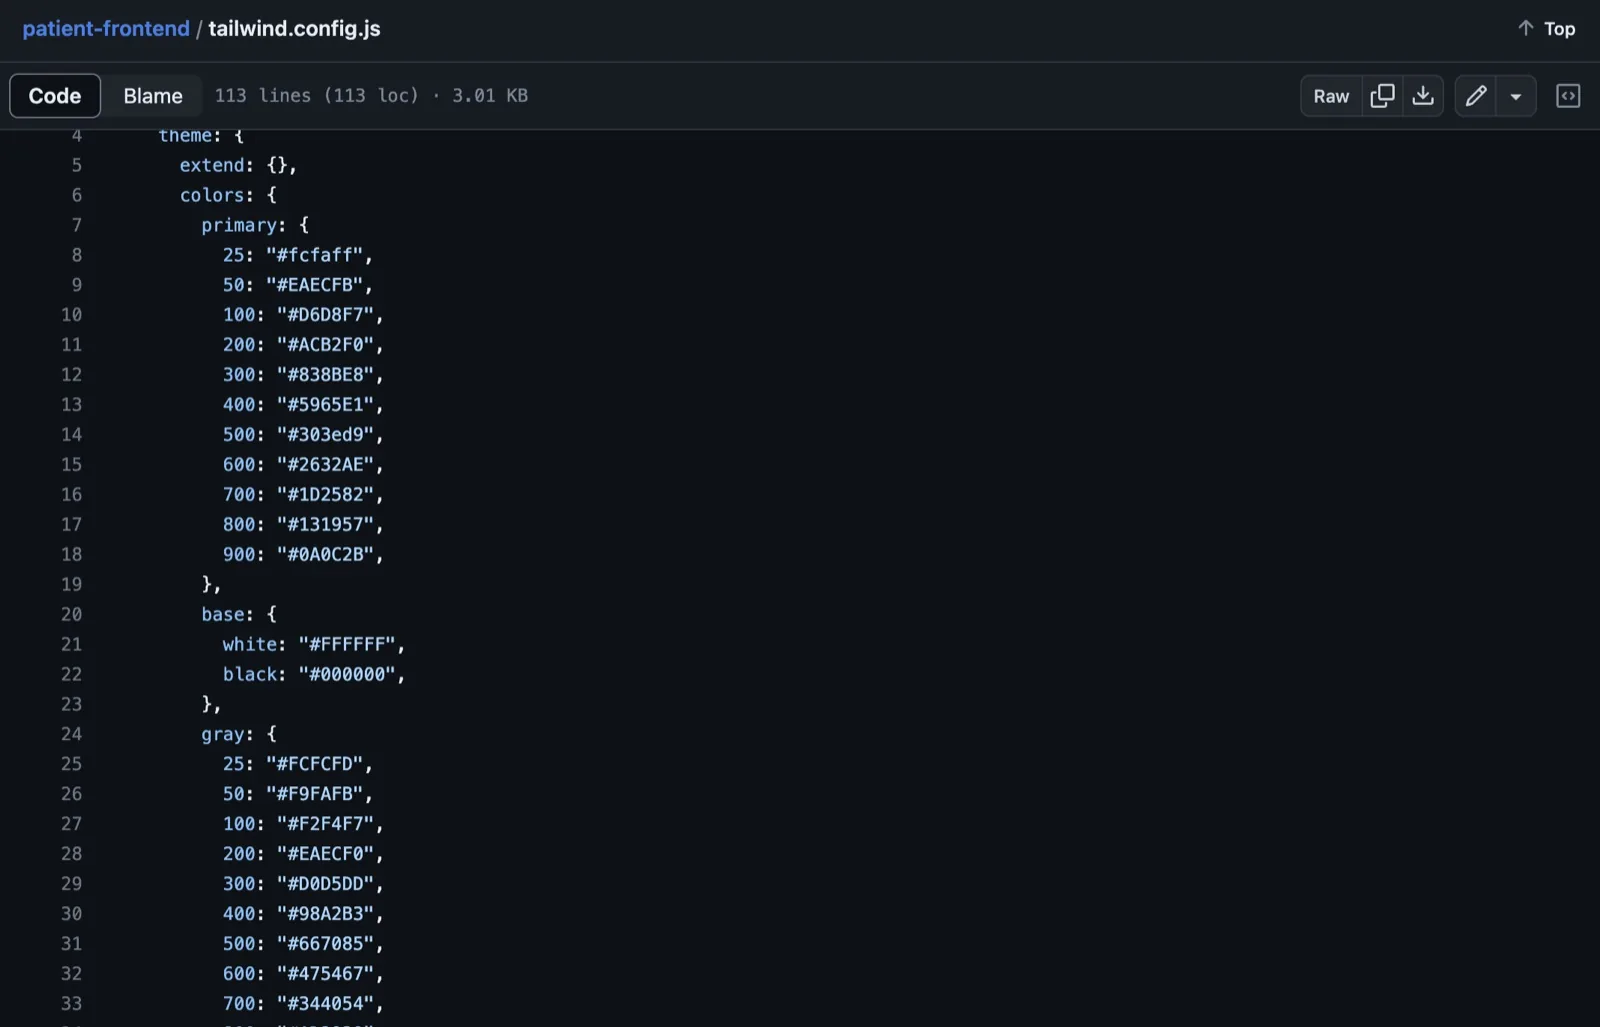
Design tokens with Tokens Studio for Figma, exported by JSON files
Transform Token Studio -> Style Dictionary -> CSS ->Tailwind css